WORKSITE SAFETY ANALYTICS THAT PREVENT INCIDENTS BEFORE THEY HAPPEN
By collecting and analyzing every detection event logged by the SCAN~LINK Armour System, SCAN~VUE gives safety managers the data they need to identify where risks are concentrating on their site, predict where incidents are most likely to occur, and build the documented safety record that proves their program is working.
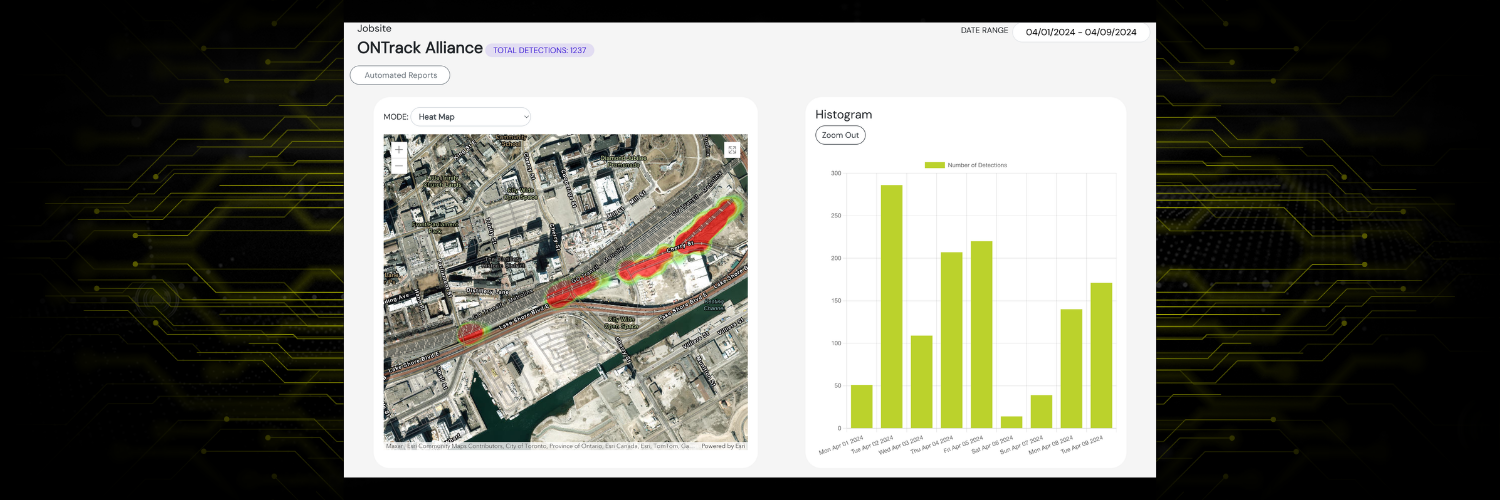
The SCAN~VUE Dashboard gives safety managers a real-time view of detection events, hotspot zones, and safety trends — accessible from any device
IMPROVE SAFETY AND SUPPORT COMPLIANCE WITH DATA & TELEMATICS
SCAN~VUE™ automatically logs every detection event with timestamps and worker IDs, giving safety managers the audit-ready reports they need for regulatory compliance. Access heat maps, trend data, and incident history from any device.
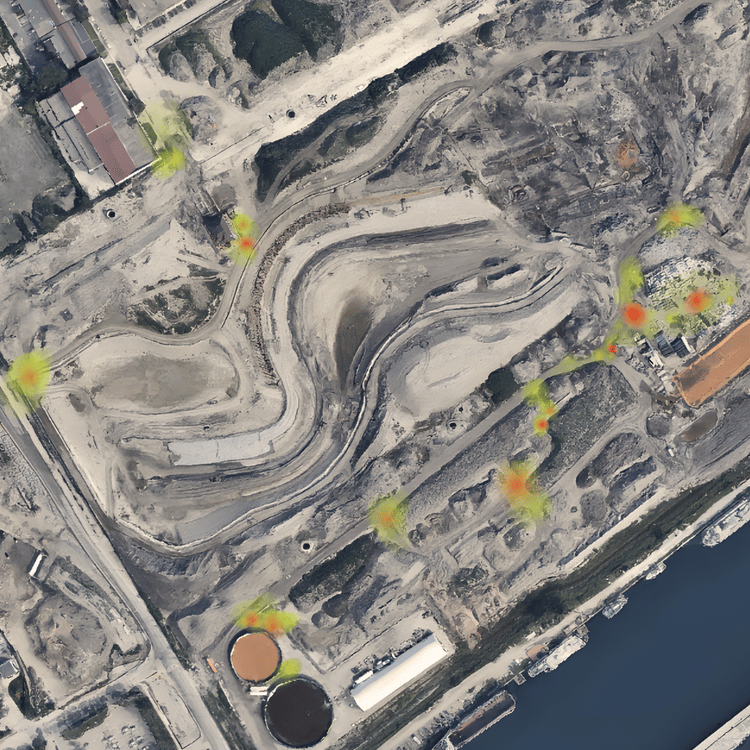
E.g: The SCAN~VUE heatmap visualizes where worker-equipment interactions occur most frequently, helping identify high-risk zones and support data-driven safety improvements.


IDENTIFY HIGH-RISK ZONES BEFORE ACCIDENTS OCCUR
SCAN~VUE's heat map and detection map views show exactly where on your site workers are most frequently entering equipment danger zones. Rather than discovering a high-risk area after a near miss or an injury, safety managers can see concentration patterns in real time and take corrective action while the worksite is still running. SCAN~VUE makes the invisible visible.
PREDICT WHERE ACCIDENTS ARE MOST LIKELY TO HAPPEN
SCAN~VUE analyzes trends over time (by shift, by equipment type, by location, and by individual tag ID) to surface the patterns that precede incidents. When the same area, the same machine, or the same time of day consistently generates elevated detection counts, SCAN~VUE flags it.
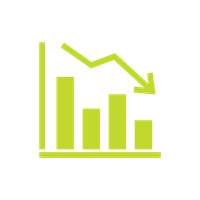
PROVE ROI WITH MEASUREABLE INCIDENT REDUCTION
The goal of SCAN~LINK is fewer detections. SCAN~VUE gives you the before-and-after data to demonstrate that your safety investment is working: fewer detection events in previously high-risk zones, improved worker proximity behaviour over time, and a documented incident history. When a safety director needs to justify a capital investment to ownership, SCAN~VUE provides the numbers to do it.
Success is not in detections, but in driving the number of detections to zero because employee behavior has changed. By having the data, the health and safety team is able to make positive and permanent changes to the company’s safety culture.
Jonathan Fava
Founder & President
SCAN~LINK Technologies Inc.
EVERYTHING INSIDE THE SCAN~VUE PLATFORM
Individual Worker Tag Assignment
Assign unique RFID tag IDs to individual workers. Every detection event is logged with the worker's ID, the equipment type, the date and time, and the GPS location. This provides a detailed, auditable interaction record.
Detection Heat Maps
Visual heat maps show where detection events are clustering on your site. Identify high-traffic danger zones at a glance and prioritize where to focus your safety interventions.
Automated Safety Reports
Schedule automated reports on detection frequency, worker safety behaviour trends, and safety performance. Or generate custom reports on demand for incident investigations or regulatory reviews.
Trend & Pattern Analysis
Analyze detection data over time to surface recurring risk patterns by shift, location, machine, or operator. Spot deteriorating safety behaviors before they become incidents.
Remote Site Monitoring
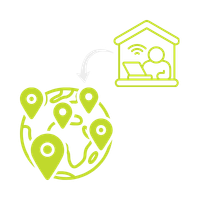
Access your SCAN~VUE dashboard from any device, from anywhere. HSE managers overseeing multiple sites can monitor safety performance across their entire operation in real time without being on site.
Compliance-Ready Reporting
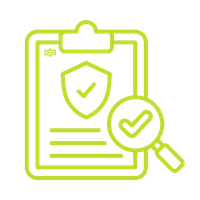
Every detection event is timestamped and stored. Generate the audit-ready documentation needed for regulatory reviews, insurance reporting, and safety performance accountability.
HOW SCAN~VUE GETS ITS DATA: THE FULL SYSTEM
1. RFID Tag + Armour System
2. Telematics Interface Unit (TIU)
3. SCAN~VUE Dashboard
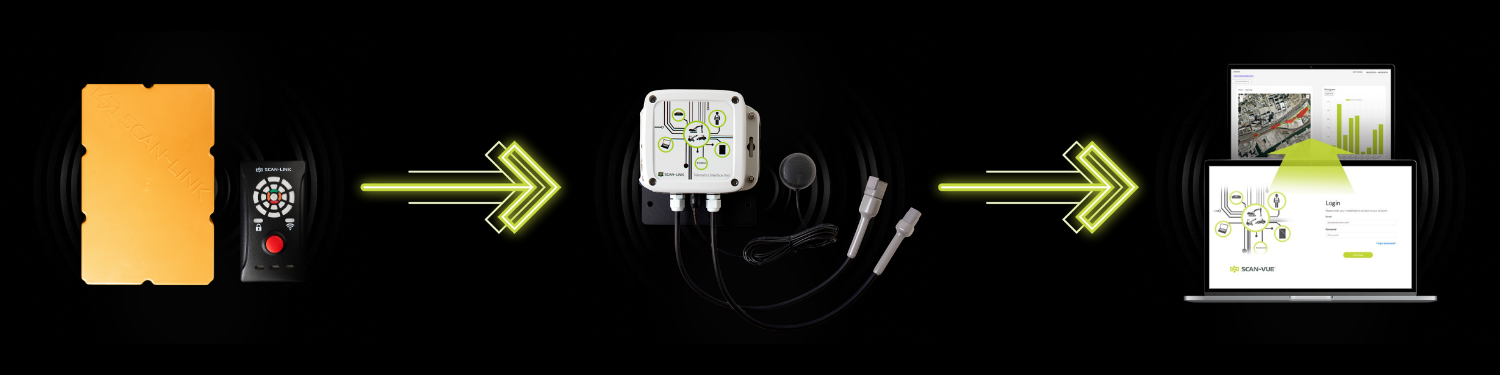
A tagged worker enters the detection zone of a SCAN~LINK Armour System antenna. The detection event is logged instantly with timestamp, tag ID, and location.
The Telematics Interface Unit (TIU), connected to or built-in to the SCAN~LINK antenna, transmits detection data from the Armour System to the SCAN~VUE cloud via 4G LTE securely and in real time.
Detection data appears in the SCAN~VUE portal, where safety managers can view heat maps, run reports, analyze trends, and export compliance documentation from any device.
BUILT FOR EVERYONE RESPONSIBLE FOR WORKSITE SAFETY
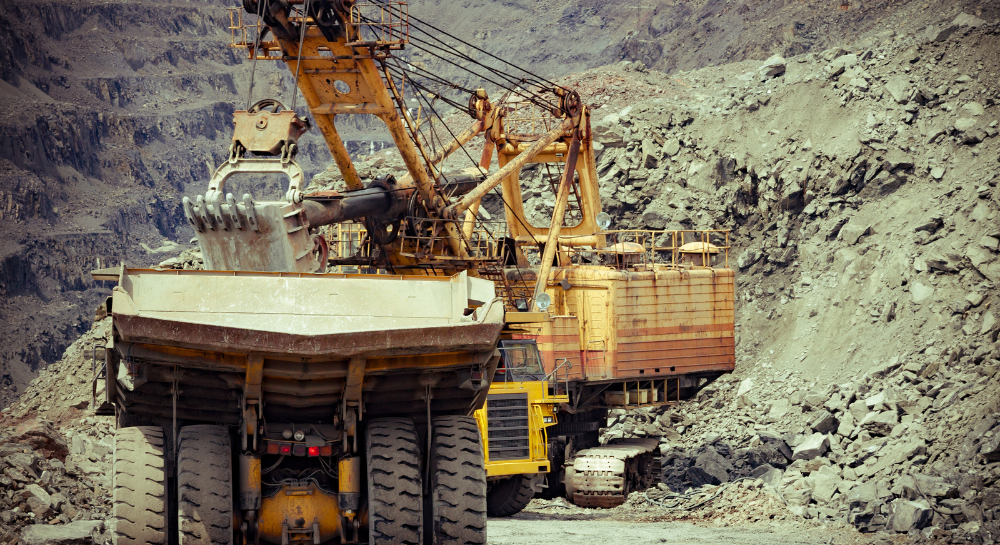
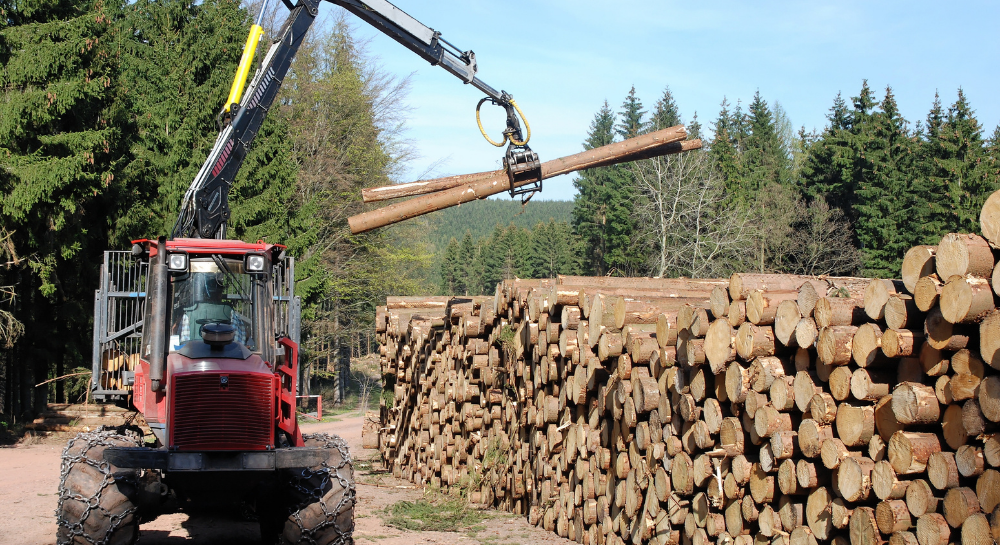
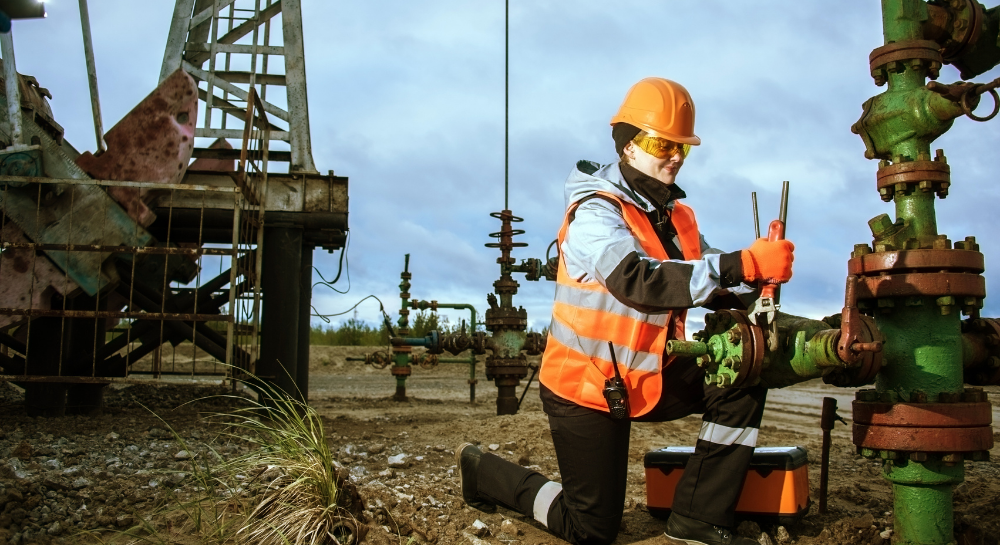
SCAN~VUE IS DEPLOYED ACROSS EVERY INDUSTRY SCAN~LINK SERVES
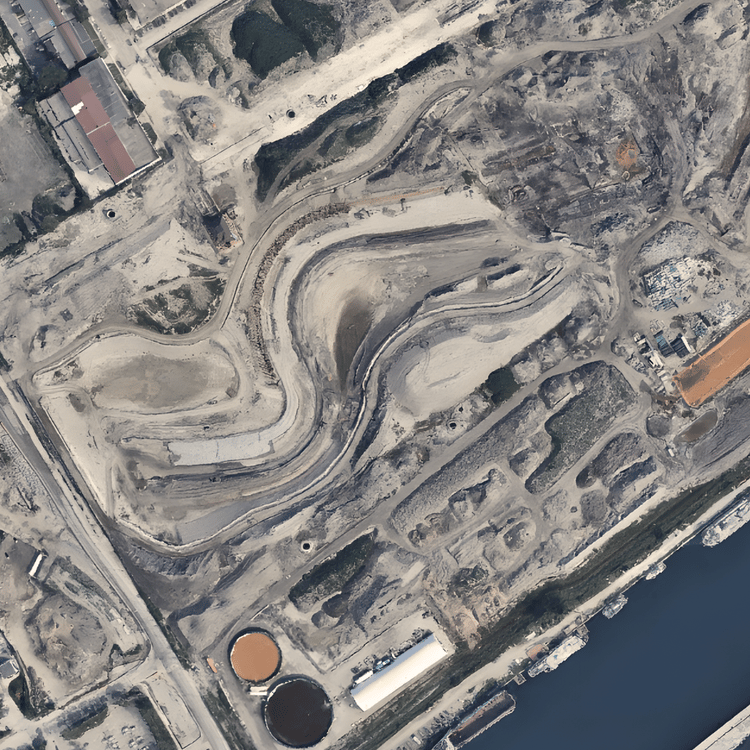
The same analytics platform that protects workers on construction sites works equally well in a forestry sort yard, a mining pit, a waste facility, an oil & gas wellsite, or an industrial plant. Near-miss data is valuable regardless of the environment.


PROUCT SPECIFICATIONS
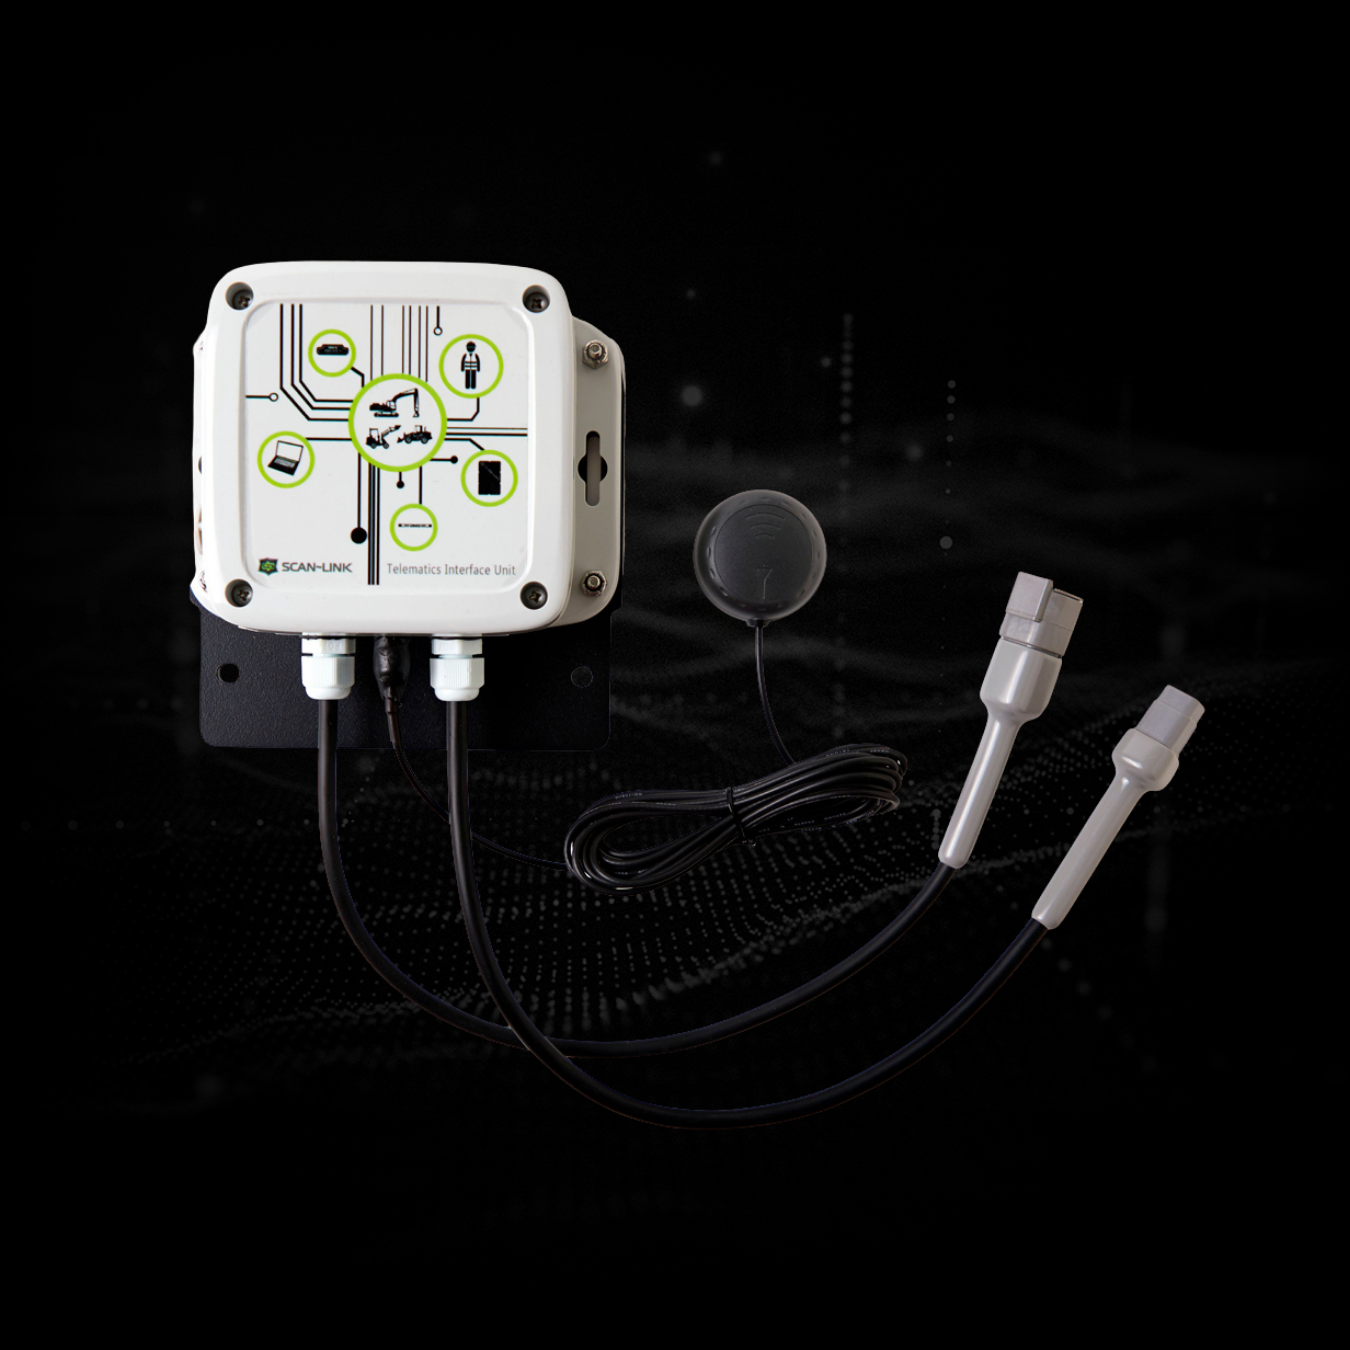
TELEMATICS INTERFACE UNIT (TIU)
A USB Dongle and software that allows a computer to communicate with SCAN~LINK Armour devices. It is used for configuring settings, troubleshooting, download data, and pairing devices together.
SPECS:
Drag & Drop interface
Compatible with Microsoft Windows change to: Microsoft® Windows™ operating systems
Dimensions: 2.78” x 0.9” x 0.35” / 7.06cm x 2.29cm x 0.89cm
Operating Temperature: 0°C – 70°C / 32°F – 158°F
The best way to understand what SCAN~VUE can do for your operation is to see it with your own data in mind. Talk to a SCAN~LINK expert and we'll walk you through the platform, answer your questions about integration and deployment, and show you how other companies in your industry are using detection data to build safer worksites.
We're Here to Support Your Safety Goals
Contact us to learn how SCAN~LINK’s passive RFID safety solutions improve safety and compliance, or request pricing and a detailed quote tailored to your jobsite.
Contact Us
Contact Us
13 Windward Dr.
Unit 204
Grimsby, Ontario
L3M 4E8
T: 1-905-304-6100
Toll Free: 1-866-554-5582
info@scan-link.com